Dashboards
Dashboards give you at-a-glance visibility into what the system sees on your network—high-level stats up top, trends over time, and fast drilldowns to details. Use the filter bar to scope results (time, hosts, subnets, TLS![]() TLS (Transport Layer Security) and its predecessor SSL (Secure Sockets Layer) are protocols for establishing authenticated and encrypted links between networked computers. attributes), then click any tile, chart, or table row to pivot into deeper investigation in Evidence. You’ll see which traffic is quantum-safe now (and which isn’t), where to prioritize remediation, and—via drilldowns—trace client↔server relationships, TLS handshakes, and certificate chains.
TLS (Transport Layer Security) and its predecessor SSL (Secure Sockets Layer) are protocols for establishing authenticated and encrypted links between networked computers. attributes), then click any tile, chart, or table row to pivot into deeper investigation in Evidence. You’ll see which traffic is quantum-safe now (and which isn’t), where to prioritize remediation, and—via drilldowns—trace client↔server relationships, TLS handshakes, and certificate chains.
Main Menu → Dashboards
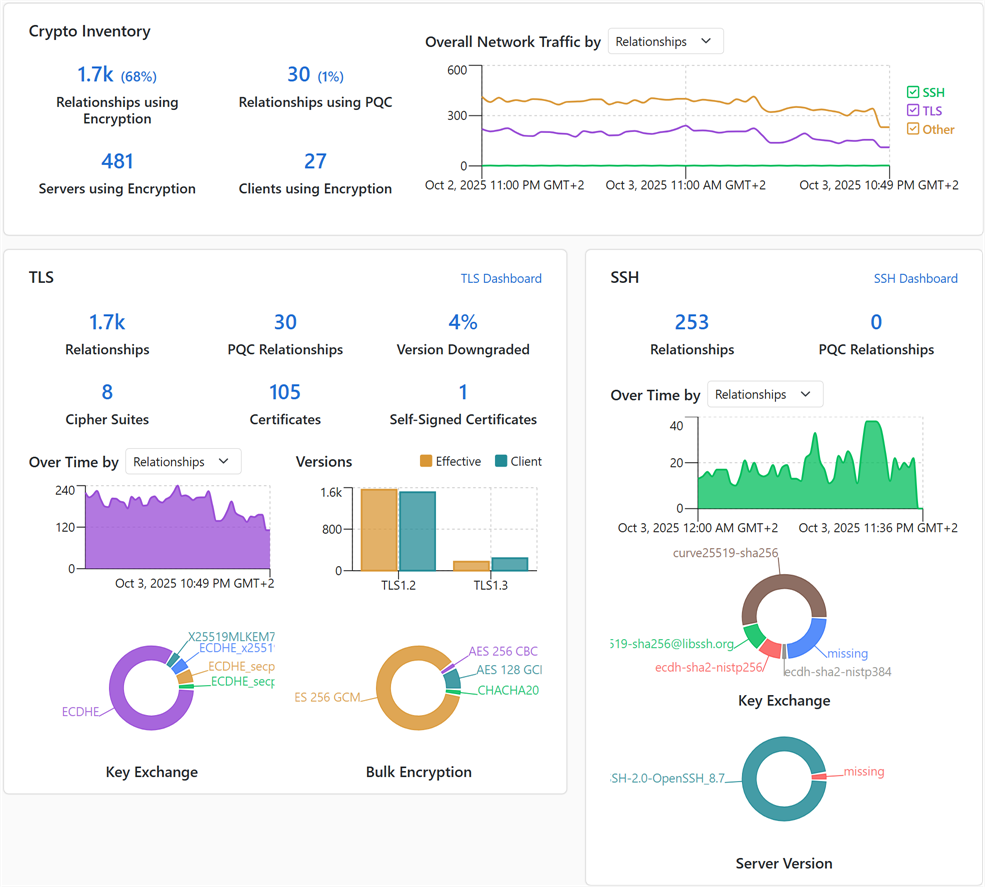
Figure 25: Crypto Inventory Dashboard
For a full description of each dashboard, see:
Drilldown
Bar, doughnut, line, and area chart drilldown options include:
-
View Relationship: View relationships for the referenced entity (e.g., client) including traffic volume, certificates, and protocol information such as TLS handshakes.
Tip: A relationship in this context is a client communicating with a service on a server, the protocol used to communicate between them for a given connection. If available, the certificate(s) used for that communication are captured. -
View Certificates: View certificates used in the relationship, if available. Certificates cannot be captured for all protocols (e.g., TLS 1.3).
- Start broad (shorter time range + simple filter), then refine.
- Certificate details may not be available for all protocols/sessions (e.g., some TLS 1.3 handshakes).
Filtering
Use the filter bar to limit the results set from which the dashboard is built using the DTA query language.
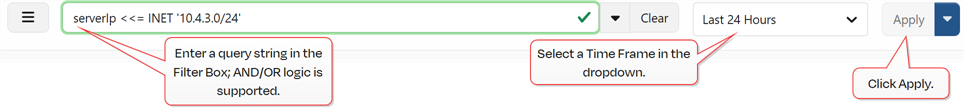
Figure 26: Filtering
Filter Bar
Type your query string in the Filter Bar. As you type, autocomplete suggests fields and operators to speed things up—but it’s not AI, so don’t expect it to infer intent. The bar validates syntax as you go; when the border turns green, your query is syntactically valid.
A full list of fields and operators is available in the DTA documentation (see DTA Documentation). Below are some examples.
Operator Cheat Sheet
=   !=                 equality / inequality (strings in single quotes)
>   <   >=   <=        numeric or date comparison
IN (...)               list include (comma-separated values)
LIKE 'foo%'            substring match (SQL-style wildcards: % and _)
~   ~*                 regex match / case-insensitive regex
<<= INET '10.10/16'    IPv4 "includes" (address in subnet)
>= INET '10.10.0.0'    IPv4 compare (range queries)
AND  OR  NOT           boolean logic (use parentheses)
Use single quotes around strings. To include a literal single quote inside a value, double it. For example:
Common Examples
Server IP in specific subnet:
Wildcard certificates:
AES 128 certificates:
Communications where RSA![]() A widely used public-key cryptosystem, RSA is commonly used for encryption and digital signatures. It is based on the mathematical difficulty of factoring large integers. was used for cipher suite key exchange (TLS 1.2 and older):
A widely used public-key cryptosystem, RSA is commonly used for encryption and digital signatures. It is based on the mathematical difficulty of factoring large integers. was used for cipher suite key exchange (TLS 1.2 and older):
Time Frame
In the Time Frame dropdown, select a time frame for your query. Options are:
-
Last 24 Hours: Ending at the current time.
-
Static Time Frame: Enter a date and time range.
-
Relative to Run Time: A rolling 24-hour window evaluated at the moment the query/report runs (e.g., at 02:00 it covers 02:00 yesterday–02:00 today). If you run it right now, it returns the same results as Last 24 Hours. The difference shows up with saved/scheduled reports:
-
Last 24 Hours saves as a fixed window anchored to when you saved it.
-
Relative to Run Time re-evaluates on each run, always using the most recent 24 hours.
Tip: Tip: For scheduled reports, choose Relative to Run Time to keep the window fresh. -
-
Last 14 Days: The most recent N full calendar days, ending at 00:00 today in the Hub’s time zone (i.e., up to 23:59:59 of yesterday). Today’s partial day is not included.
Example: If today is August 20, Last 14 Days covers August 6 00:00 → August 20 00:00.Tip: If you want up to right now, use a Static Time Frame window instead. -
Last 30 Days: The most recent N full calendar days, ending at 00:00 today in the Hub’s time zone (i.e., up to 23:59:59 of yesterday). Today’s partial day is not included.
-
Last 90 Days: The most recent N full calendar days, ending at 00:00 today in the Hub’s time zone (i.e., up to 23:59:59 of yesterday). Today’s partial day is not included.
DTA Documentation
The DTA documentation lists all supported filters and operators; some options may not apply to the current page.
The DTA documentation contains three sections:
- DTA Filter Operators: Comparison operations (e.g., =, !=, LIKE)
- DTA Discovery:
 Metadata provides information about a piece of data. It is used to summarize basic information about data, which can make working with the data easier. In Keyfactor Command, the certificate metadata feature allows you to create custom metadata fields that allow you to tag certificates with tracking information about certificates. with metrics (e.g. certIssuer, certSubject) resulting from communications between endpoints (clients, servers, services, ports, protocols, crypto)
 -
DTA Cert:
Was this page helpful? Provide Feedback