Dashboards: TLS
The TLS![]() TLS (Transport Layer Security) and its predecessor SSL (Secure Sockets Layer) are protocols for establishing authenticated and encrypted links between networked computers. Dashboard presents four panels that summarize TLS attributes observed in captured client–server traffic, giving you a high-level view of your environment at a glance.
TLS (Transport Layer Security) and its predecessor SSL (Secure Sockets Layer) are protocols for establishing authenticated and encrypted links between networked computers. Dashboard presents four panels that summarize TLS attributes observed in captured client–server traffic, giving you a high-level view of your environment at a glance.
Main Menu → Dashboards → TLS
TLS Panel
-
Overall counts of Relationships by TLS version, in data point and bar graph formats, with post-quantum readiness indicators and drilldown (see Drilldown) data points.
-
Relationships (data point)
-
PQC
 Cryptographic algorithms designed to be secure against the potential capabilities of quantum computers, which could break traditional encryption methods. Relationship (data point)
 -
TLS Version Downgraded (percentage)
Tip: Pay close attention to the Version Downgraded percentage. Often clients will downgrade their cryptography to unsafe levels, and it is a good indicator of clients that will be unable to support the PQC encryption algorithms. -
-
Overtime counts by either Relationships or Traffic Volumein line graph format with drilldown data points.
Certificates Panel
The certificates panel includes counts, charts and donuts:
-
Certificate Counts: Counts by total, self-signed, wildcard, and CAs.
-
Expirations: Certificate expiration in bar graph format by:
-
Expired
-
Expiring in less than 1 day
-
Expiring in less than 7 days
-
Expiring in less than 30 days
-
Expiring in less than 90 days
Some labels may not display if the graph width is too narrow.
-
-
Signing Algorithm: Certificates by signing algorithm with drilldown to view the certificates and the relationships, in doughnut chart format.
-
Public Key Algorithm: Certificates by public key
In asymmetric cryptography, public keys are used together in a key pair with a private key. The private key is retained by the key's creator while the public key is widely distributed to any user or target needing to interact with the holder of the private key. algorithm with drilldown to view the certificates and the relationships, in doughnut chart format.
Over Time by Relationships or Traffic Volume Panel
A dropdown to choose between displaying:
-
Relationships: Area chart of
Tip: A relationship is a client communicating with a service on a server over a specific protocol/port during a connection. When available, the TLS/SSH The SSH (secure shell) protocol provides for secure connections between computers. It provides several options for authentication, including public key, and protects the communications with strong encryption. handshake details and certificate(s) used for that communication are recorded with the relationship. -
Traffic Volume: Area chart showing identified
The dashboard results can be filtered and the time frame updated using the Filter Bar (see Filtering).
Click the  icon to filter the dashboard further by that data point.
Cipher Suites Panel
Doughnut Charts:
-
Key Exchange: Relationships by key exchange type, with drilldown to view the relationships.
-
Signature: Relationships by signature method, with drilldown to view the relationships.
-
Bulk Encryption: Relationships by bulk encryption method, with drilldown to view the relationships.
-
Message Authentication: Relationships by message authentication type, with drilldown to view the relationships.
Cipher Suites in Use Chart:
-
A list of cipher suites with counts of relationships, servers and clients for each. Click the
icon to see the TLS dashboard filtered for that suite.
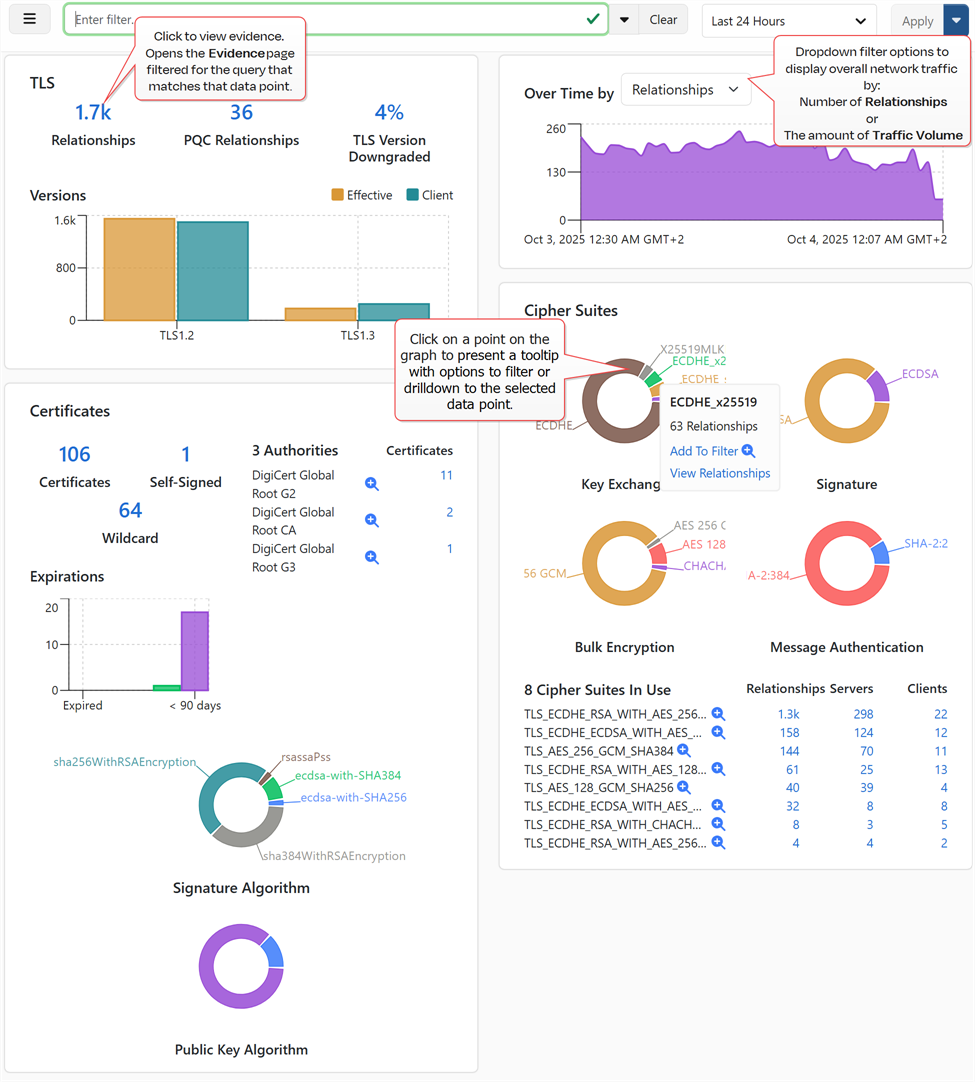
Figure 29: TLS Protocol Specific Dashboard
Was this page helpful? Provide Feedback