Evidence
The Evidence page is a powerful query interface over CipherInsights’s REST APIs. It lets you search, filter, sort, and export network discovery data and certificate data—without writing code.
Main Menu → Evidence
You can query two data sets:
-
Discovery: Communications between endpoints (clients, servers, services, ports, protocols, crypto).
-
Cert: Certificates observed by CipherInsights and/or loaded from trust stores.
Need the raw API![]() An API is a set of functions to allow creation of applications. Keyfactor offers the Keyfactor API, which allows third-party software to integrate with the advanced certificate enrollment and management features of Keyfactor Command.? See REST APIs Overview for endpoint
An API is a set of functions to allow creation of applications. Keyfactor offers the Keyfactor API, which allows third-party software to integrate with the advanced certificate enrollment and management features of Keyfactor Command.? See REST APIs Overview for endpoint![]() An endpoint is a URL that enables the API to gain access to resources on a server. details and OpenAPI.
An endpoint is a URL that enables the API to gain access to resources on a server. details and OpenAPI.
Supported actions on this page are:
-
API Selector
Switch between Discovery and Cert.
-
Saved Queries (More Actions Menu)
Load your own saved queries.
Note: Saved queries are stored per API selector; select an API first to locate queries saved for that API. -
Default Queries (More Actions Menu)
Load pre-configured queries.
-
Discovery: Relationships, Servers, Clients, Databases, or Cipher Suites
-
Certificates: Certificates, Certificate Authorities, Invalid Certificates
-
-
Created Reports (More Actions Menu)
Run the queries for reports created using Save Query (this does not run the actual report).
-
Filter Bar
SQL-like filter strings (see Filtering).
-
Time Frame:
The date/time window (for Discovery only):
-
Last 24 Hours: Ending at the current time.
-
Static Time Frame: Enter a date and time range.
-
Relative to Run Time: A rolling 24-hour window evaluated at the moment the query/report runs (e.g., at 02:00 it covers 02:00 yesterday–02:00 today). If you run it right now, it returns the same results as Last 24 Hours. The difference shows up with saved/scheduled reports:
-
Last 24 Hours saves as a fixed window anchored to when you saved it.
-
Relative to Run Time re-evaluates on each run, always using the most recent 24 hours.
Tip: Tip: For scheduled reports, choose Relative to Run Time to keep the window fresh. -
-
Last 14 Days: The most recent N full calendar days, ending at 00:00 today in the Hub’s time zone (i.e., up to 23:59:59 of yesterday). Today’s partial day is not included.
Example: If today is August 20, Last 14 Days covers August 6 00:00 → August 20 00:00.Tip: If you want up to right now, use a Static Time Frame window instead. -
Last 30 Days: The most recent N full calendar days, ending at 00:00 today in the Hub’s time zone (i.e., up to 23:59:59 of yesterday). Today’s partial day is not included.
-
Last 90 Days: The most recent N full calendar days, ending at 00:00 today in the Hub’s time zone (i.e., up to 23:59:59 of yesterday). Today’s partial day is not included.
-
-
Apply
Runs the current query and saves it to history.
-
Save Query (Apply Dropdown)
Saves the current filter, time, column, and sort settings with option to create a report (see Create a Report).
-
Export CSV (Apply Dropdown)
Download query results as CSV.
-
Advanced Mode (Apply Dropdown)
Shows extra/internal IDs and diagnostic fields (hidden by default).
-
Download OpenAPI Spec (Apply Dropdown)
Download the OpenAPI specification for the CipherInsights REST API (for use with Swagger UI, Postman, or client code generators).
-
Documentation (Apply Dropdown)
Open the filter/query syntax help (fields and operators).
-
Columns
Fields to include in results; drag in the columns selector box to reorder.
-
Sorts
One or more sort keys (ASC/DESC).
Actions may appear as toolbar buttons, links in grid rows, or inside the More actions (![]() ) menu. If you don’t see an action as a button or in the grid, open More actions (
) menu. If you don’t see an action as a button or in the grid, open More actions (![]() ) and look for it there. Availability of actions depends on your selection, item status, and permissions.
) and look for it there. Availability of actions depends on your selection, item status, and permissions.
Choose how many items to display in the Rows per page dropdown (e.g., 10, 25, 50). Use the Next/Previous controls to view additional records. Most fields are sortable.
Filtering
Use the filter bar to query certificates or discovery records with the DTA query language.
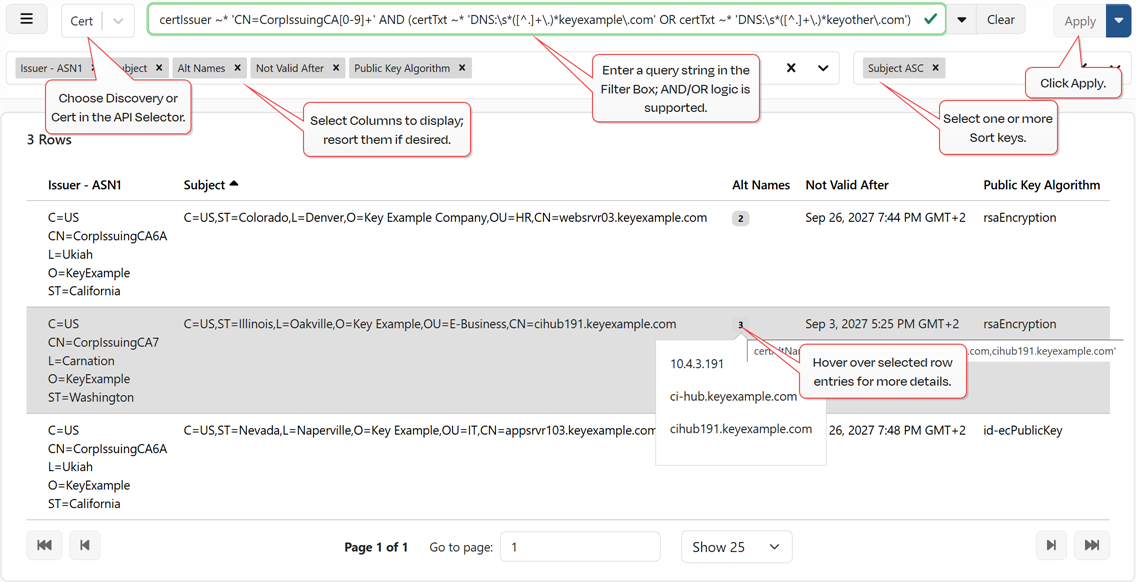
Figure 40: Cert Filtering
API Selector
In the API Selector, choose either Discovery or Cert to define the set of filters you will work with.
Filter Bar
Type your query string in the Filter Bar. As you type, autocomplete suggests fields and operators to speed things up—but it’s not AI, so don’t expect it to infer intent. The bar validates syntax as you go; when the border turns green, your query is syntactically valid.
A full list of fields and operators is available in the DTA documentation (see DTA Documentation). Below are some examples.
Operator Cheat Sheet
=   !=                 equality / inequality (strings in single quotes)
>   <   >=   <=        numeric or date comparison
IN (...)               list include (comma-separated values)
LIKE 'foo%'            substring match (SQL-style wildcards: % and _)
~   ~*                 regex match / case-insensitive regex
<<= INET '10.10/16'    IPv4 "includes" (address in subnet)
>= INET '10.10.0.0'    IPv4 compare (range queries)
AND  OR  NOT           boolean logic (use parentheses)
Use single quotes around strings. To include a literal single quote inside a value, double it. For example:
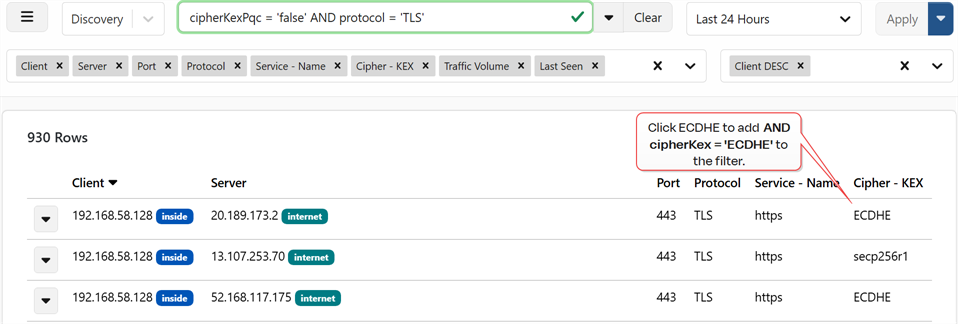
Figure 41: Click to Filter
Common
Expired or expiring certificates:
Subject alternate name (SAN![]() The subject alternative name (SAN) is an extension to the X.509 specification that allows you to specify additional values when enrolling for a digital certificate. A variety of SAN formats are supported, with DNS name being the most common.) list contains a domain:
The subject alternative name (SAN) is an extension to the X.509 specification that allows you to specify additional values when enrolling for a digital certificate. A variety of SAN formats are supported, with DNS name being the most common.) list contains a domain:
Subject alternate name (SAN) list contains a specific DNS![]() The Domain Name System is a service that translates names into IP addresses. SAN:
The Domain Name System is a service that translates names into IP addresses. SAN:
Subject alternate name (SAN) list contains a specific IP SAN:
Common name of certificate issuer:
Wildcard certificates:
Filter out certificates in trust stores used for validation and list only those found in network capture:
Common
Server IP in specific subnet:
Wildcard certificates:
AES 128 certificates:
Communications where RSA![]() A widely used public-key cryptosystem, RSA is commonly used for encryption and digital signatures. It is based on the mathematical difficulty of factoring large integers. was used for cipher suite key exchange (TLS
A widely used public-key cryptosystem, RSA is commonly used for encryption and digital signatures. It is based on the mathematical difficulty of factoring large integers. was used for cipher suite key exchange (TLS![]() TLS (Transport Layer Security) and its predecessor SSL (Secure Sockets Layer) are protocols for establishing authenticated and encrypted links between networked computers. 1.2 and older):
TLS (Transport Layer Security) and its predecessor SSL (Secure Sockets Layer) are protocols for establishing authenticated and encrypted links between networked computers. 1.2 and older):
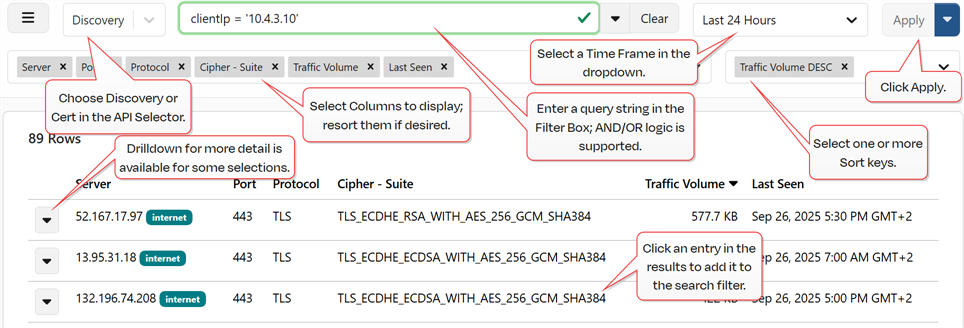
Figure 39: Discovery Results shows every server that communicated with client 10.4.3.10, including the port, protocol, TLS cipher suite, traffic volume, and last-seen time for each unique server/port/protocol/cipher combination in the selected time range.
Time Frame
In the Time Frame dropdown, select a time frame for your query. Options are:
-
Last 24 Hours: Ending at the current time.
-
Static Time Frame: Enter a date and time range.
-
Relative to Run Time: A rolling 24-hour window evaluated at the moment the query/report runs (e.g., at 02:00 it covers 02:00 yesterday–02:00 today). If you run it right now, it returns the same results as Last 24 Hours. The difference shows up with saved/scheduled reports:
-
Last 24 Hours saves as a fixed window anchored to when you saved it.
-
Relative to Run Time re-evaluates on each run, always using the most recent 24 hours.
Tip: Tip: For scheduled reports, choose Relative to Run Time to keep the window fresh. -
-
Last 14 Days: The most recent N full calendar days, ending at 00:00 today in the Hub’s time zone (i.e., up to 23:59:59 of yesterday). Today’s partial day is not included.
Example: If today is August 20, Last 14 Days covers August 6 00:00 → August 20 00:00.Tip: If you want up to right now, use a Static Time Frame window instead. -
Last 30 Days: The most recent N full calendar days, ending at 00:00 today in the Hub’s time zone (i.e., up to 23:59:59 of yesterday). Today’s partial day is not included.
-
Last 90 Days: The most recent N full calendar days, ending at 00:00 today in the Hub’s time zone (i.e., up to 23:59:59 of yesterday). Today’s partial day is not included.
DTA Documentation
The DTA documentation lists all supported filters and operators; some options may not apply to the current page.
The DTA documentation contains three sections:
- DTA Filter Operators: Comparison operations (e.g., =, !=, LIKE)
- DTA Discovery:
 Metadata provides information about a piece of data. It is used to summarize basic information about data, which can make working with the data easier. In Keyfactor Command, the certificate metadata feature allows you to create custom metadata fields that allow you to tag certificates with tracking information about certificates. with metrics (e.g. certIssuer, certSubject) resulting from communications between endpoints (clients, servers, services, ports, protocols, crypto)
 -
DTA Cert:
Columns
In the Columns dropdown, select one or more columns to display in the grid. These must be selected before you can apply your filter.
To sort the columns, drag to rearrange in the column selector box.
Sort
If desired, select a sort order for your results. If you do not select an order, the results will sort ascending by the first column.
Drilldown
For discovery records, depending on the filter applied and columns selected, you may see a dropdown option to the left of each record in the results grid. The offered options vary depending on the data available for the record and may include any of the following detailed panes:
-
View Relationship(s): View relationships for the referenced entity (e.g., client) including traffic volume, certificates, and protocol information such as TLS handshakes.
Tip: A relationship is a client communicating with a service on a server over a specific protocol/port during a connection. When available, the TLS/SSH The SSH (secure shell) protocol provides for secure connections between computers. It provides several options for authentication, including public key, and protects the communications with strong encryption. handshake details and certificate(s) used for that communication are recorded with the relationship. -
-
-
-
View Cipher Suites: View cipher suites used in the relationship.
Further drilldown may be available within each drilldown page depending on the information accessed.
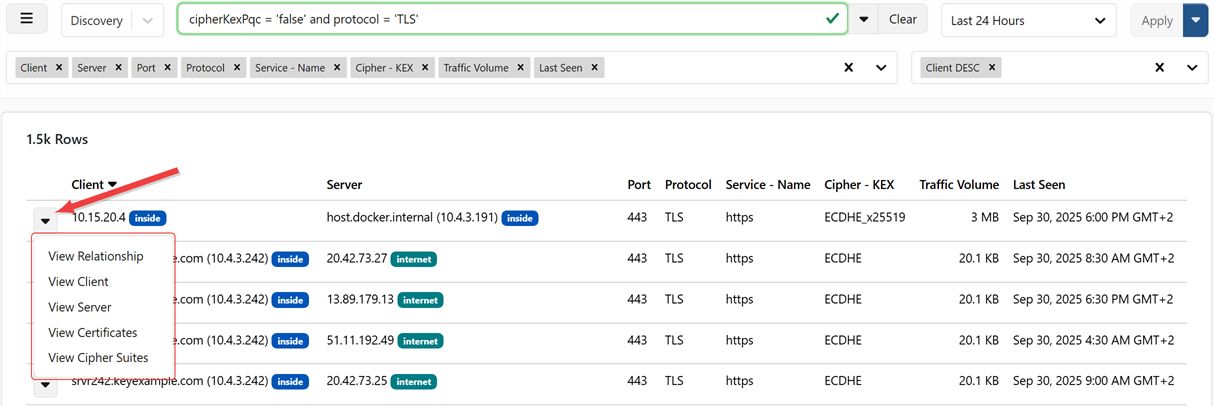
Figure 42: Drilldown Menu
View Relationship
Use this view to examine the client↔server relationship for the selected record, including basic relationship data such as the client, server, and protocol in question, traffic volume over time, certificates (when available), and protocol details such as TLS handshakes.
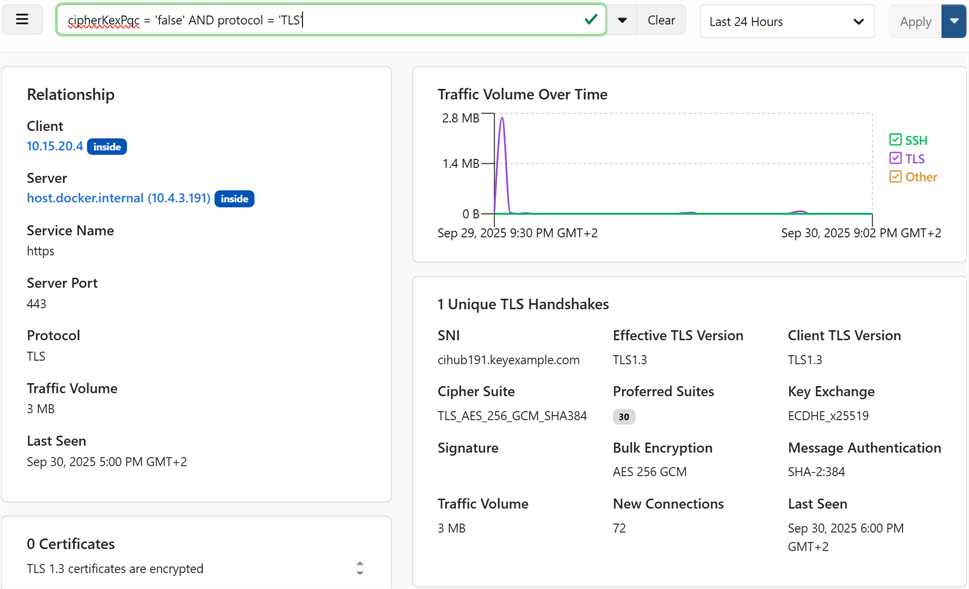
Figure 43: Drilldown: View Relationship
View Client
Use this view to profile the client—which servers it contacted, its relationships, and any certificates observed in those relationships (if available). Further drilldown is available from here for the servers and relationships.
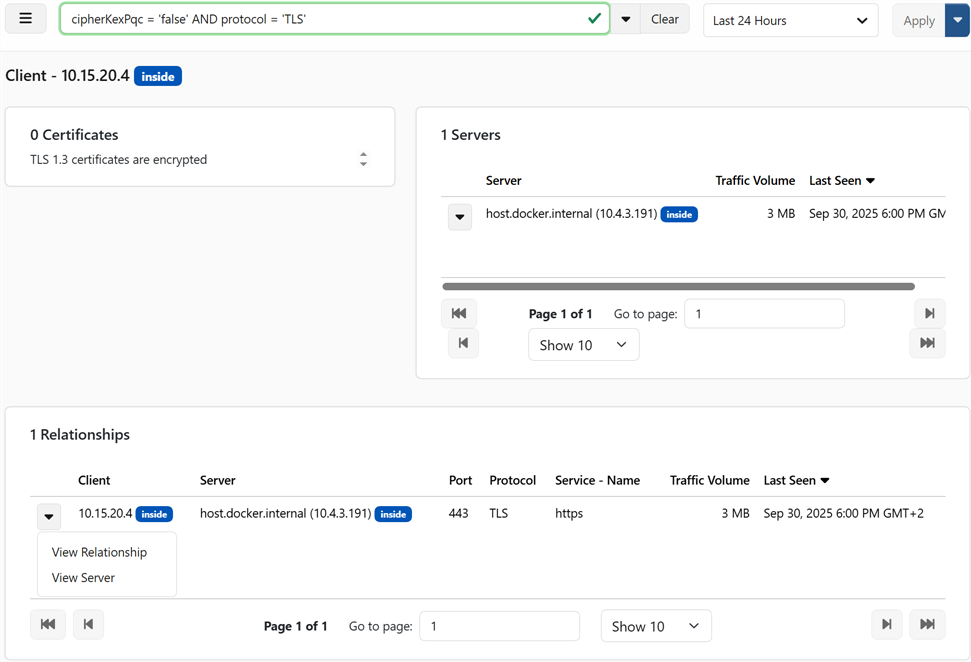
Figure 44: Drilldown: View Client
View Server
Use this view to profile the server—which clients connected, its relationships, and any certificates observed in those relationships (if available). Further drilldown is available from here for the clients and relationships.
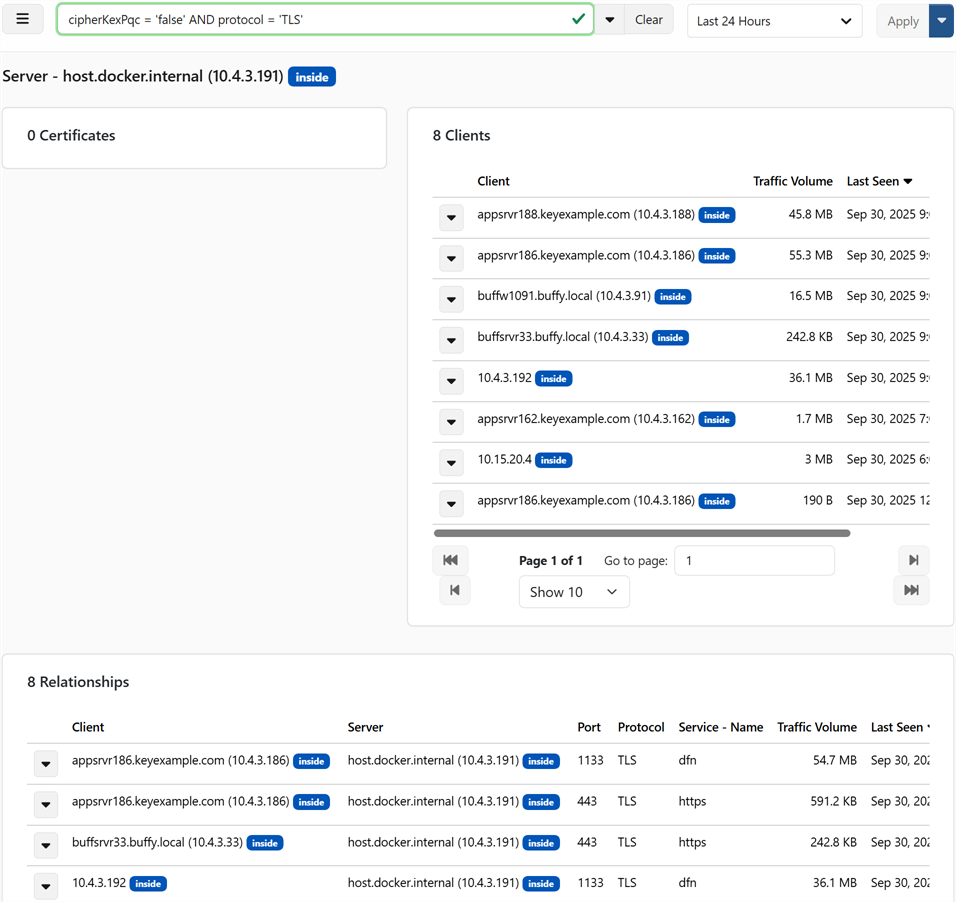
Figure 45: Drilldown: View Server
View Certificates
Use this view to list certificates associated with the selected record—certificate details may not be available for all sessions (e.g., some TLS 1.3 handshakes). Further drilldown is available from here for related certificates, clients, servers, and relationships.
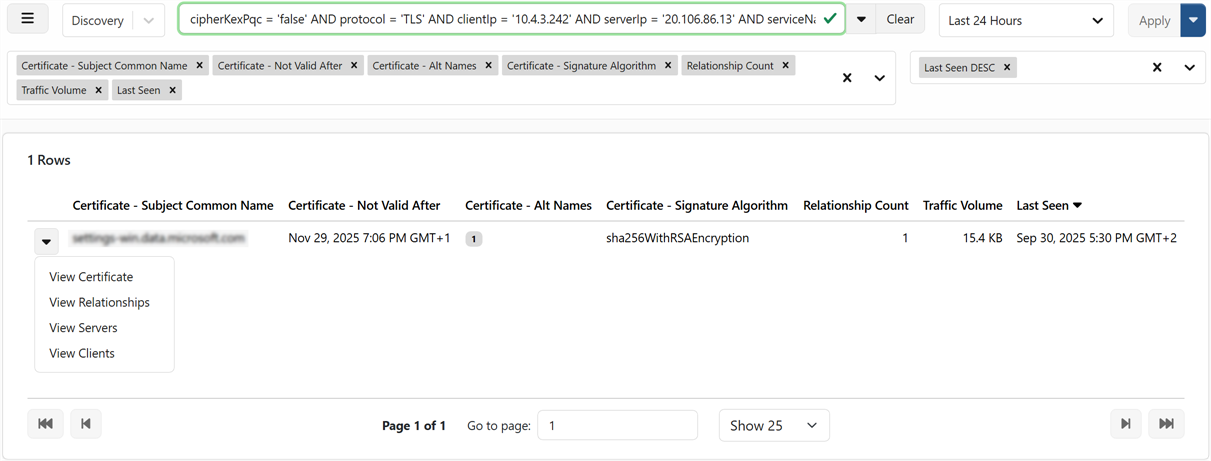
Figure 46: Drilldown: View Certificates
View Cipher Suites
Use this view to see the cipher suites observed for the selected relationship or endpoint.Further drilldown is available from here for clients, servers, and relationships.
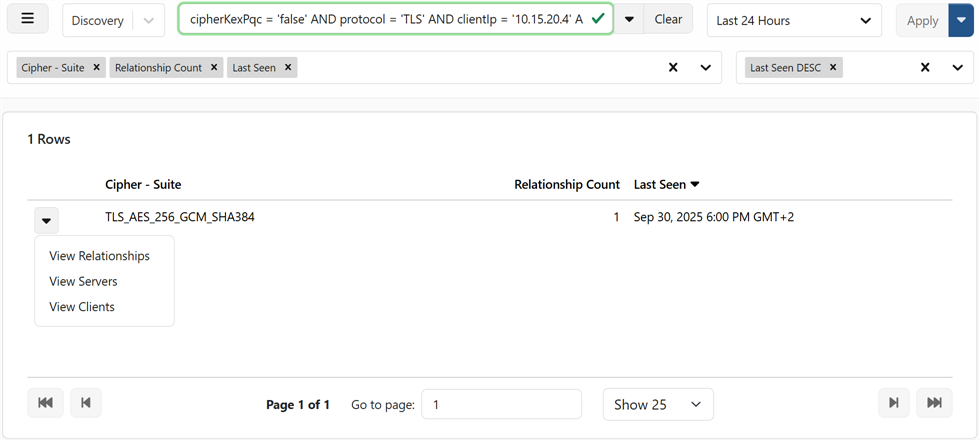
Figure 47: Drilldown: View Cipher Suites
Create a Report
When you choose Save Query, you have the option to create a report with the query data. Saved reports appear on the reports page under Dta Reports (see Reports). They also appear on the More actions menu under Created Reports as queries.
On the Save Query and Create Report dialog, complete the fields, using the options, below, and click Save Query and Create Report.
Create Report Options
-
Name
Short, unique name for this report configuration (used in lists and logs).
-
Description
Optional notes about what this report covers (scope, audience, etc.).
-
Run nightly
When enabled, schedules this report to run automatically each night.
Tip: Once the report is created, you can adjust the schedule with more options in Reports (see Reports). -
Report title
Human-readable title shown at the top of the PDF (if generated).
-
Unique component of output filename
A string that becomes part of the saved filename, which can help to local reports using search (see resulting reports in File Management).
Example: Entering keyexample produces files like dtaReport-keyexample-2025-09-26--11 (where the date and instance number will vary). -
DTA command
The API being queried. This is prepopulated from the query you just ran.
-
DTA arguments
The filter and columns derived from your current query—prepopulated and editable if needed.
-
Generate PDF report (default: off)
Produce a formatted PDF with the selected columns (subject to the row limit below).
-
Generate CSV report (default: on)
Export raw results as a CSV for spreadsheets and external analysis.
-
Number of rows to show in PDF report (Advanced option)
Limits the number of rows rendered in the PDF (1–500), regardless of whether CSV is also selected. Has no effect on CSV size.
-
Create a ZIP when more than one file is created (Advanced option)
If multiple outputs are generated (e.g., PDF and CSV), bundle them into a single ZIP for easier download.
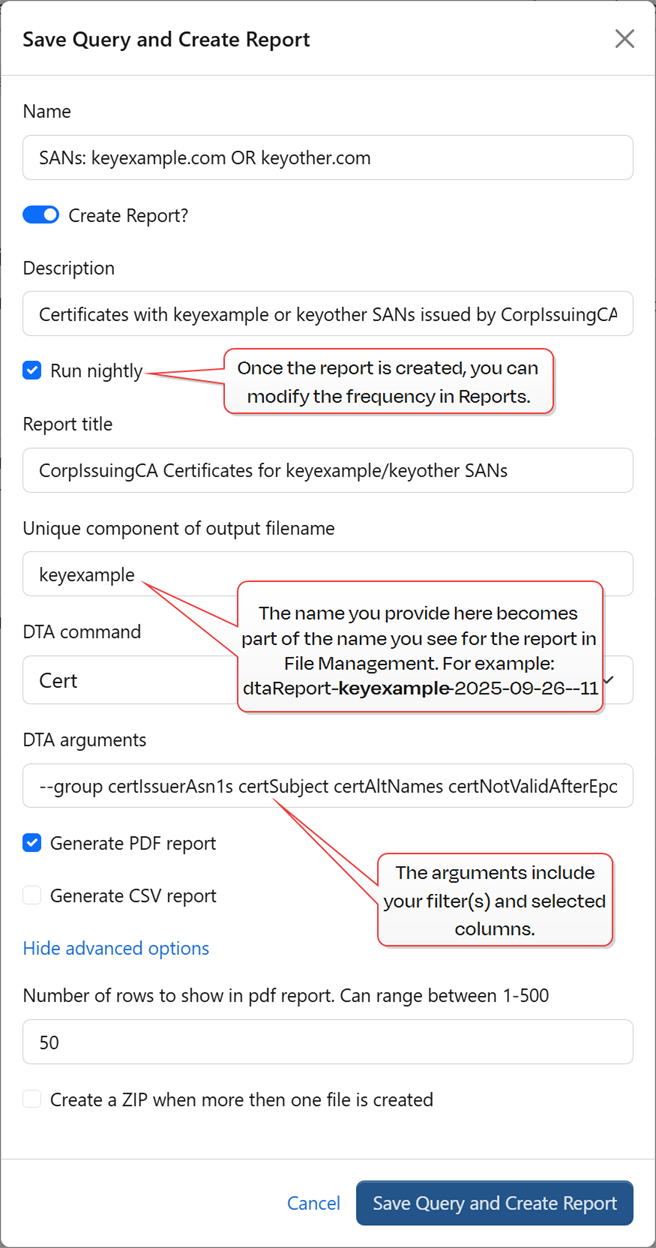
Figure 48: Create a Report
Was this page helpful? Provide Feedback