The dashboard, at the top level of the Management Portal, provides you with a quick glance at the status of your PKI![]() A public key infrastructure (PKI) is a set of roles, policies, and procedures needed to create, manage, distribute, use, store and revoke digital certificates and manage public-key encryption.. It is a global representation of your PKI and does not filter data based on your access.
A public key infrastructure (PKI) is a set of roles, policies, and procedures needed to create, manage, distribute, use, store and revoke digital certificates and manage public-key encryption.. It is a global representation of your PKI and does not filter data based on your access.
Risk Header
The top of the page shows a risk header, which is made up of six sticky notes displaying active certificates, expiring and expired certificates, revoked certificates, and certificates with weak keys. The dashboard risk header displays by default and cannot be moved or removed (though it may be hidden with a security setting).

Figure 7: Dashboard Risk Header
The risk header panels are:
-
Active Certificates
This value reflects all active certificates in the database, including those with a certificate state of unknown, and excludes expired and revoked certificates.
-
Certificates Expiring in Less Than 48 Hours
This value includes all active certificates in the database with an expiration date between the current date/time and 48 hours from the current date/time.
-
Certificates Expiring in Less Than 14 Days
This value includes all active certificates in the database with an expiration date between the current date/time and 14 days (to the minute) from the current date/time. This value includes certificates shown in the Expiring in < 48 Hours panel.
-
Certificates Expired in the Last 7 Days
This value includes all certificates that have expired within the previous 7 days. This is the only panel that includes expired certificates.
-
Certificates Revoked in the Last 7 Days
This value includes all certificates that have been revoked within the previous 7 days. This is the only panel that includes revoked certificates.
-
Certificates with Weak Keys
This value includes all certificates in the database that are deemed to have weak keys. Weak key certificates are those with signature algorithms SHA-1, MD5, RSA key size
 The key size or key length is the number of bits in a key used by a cryptographic algorithm. less than 2048, and ECC
 Elliptical curve cryptography (ECC) is a public key encryption technique based on elliptic curve theory that can be used to create faster, smaller, and more efficient cryptographic keys. ECC generates keys through the properties of the elliptic curve equation instead of the traditional method of generation as the product of very large prime numbers. key size less than 224.
Customizable Panels
A variety of panels are available to add to the dashboard, including:
- A separate panel for each of your certificate authorities (CAs) configured for synchronization can be displayed with graphs showing the activity over the last X weeks (24 by default) and a pie chart showing all active certificates by template
 A certificate template defines the policies and rules that a CA uses when a request for a certificate is received..
The number of weeks to display is configurable on a panel-by-panel basis. See Dashboard: CA Status.Note: Any CAs that have not been configured for synchronization will not appear as available for addition on the dashboard, or for reports which require selecting a CA.
 - Certificate collections (see Certificate Collection Manager) can be configured to be included in a bar chart on the Certificate Collection dashboard panel. See Dashboard: Collections.
- The Certificates by Signing Algorithm panel displays a bar chart showing all active certificates broken down by signing algorithm. The CAs to include in the display are configurable. Both CAs that are currently configured for synchronization and any that were previously synchronized are available for inclusion. Certificates imported into Keyfactor Command via SSL
 TLS (Transport Layer Security) and its predecessor SSL (Secure Sockets Layer) are protocols for establishing authenticated and encrypted links between networked computers. scanning, certificate store inventorying, and manual import are also included and can be filtered out by unchecking the Certificates Not Associated with CA option. See Dashboard: Certificates by Signing Algorithm.
 - The Recent Certificate Store Jobs panel displays the status of up to ten jobs. Both completed and in progress jobs are included. See Dashboard: Recent Certificate Store Jobs.
- If you configure certificate revocation list
 A Certificate Revocation List (CRL) is a list of digital certificates that have been revoked by the issuing Certificate Authority (CA) before their scheduled expiration date and should no longer be trusted. (CRL
 A Certificate Revocation List (CRL) is a list of digital certificates that have been revoked by the issuing Certificate Authority (CA) before their scheduled expiration date and should no longer be trusted.) or online certificate status protocol (OCSP) locations for monitoring and opt to display them on the dashboard (see Revocation Monitoring), these will appear with a status on the dashboard Revocation Monitoring panel. See Dashboard: Revocation Monitoring.
 - The comprehensive SSL Endpoints panel includes a grid of changes found in existing SSL endpoints, a grid of endpoints with certificates expiring in the next X days, a pie chart showing SSL endpoints per defined SSL network, and a pie chart showing the results from the last SSL scan broken out by result (e.g. certificate found, connection timed out, connection refused). The number of days for the expiring certificates grid is configurable. See Dashboard: SSL Endpoints.
- The status of SSL discovery and monitoring jobs can be displayed on an orchestrator
 Keyfactor orchestrators perform a variety of functions, including managing certificate stores and SSH key stores.-by-orchestrator basis on the SSL Orchestrator Job Status panel. The orchestrators to include are configurable. See Dashboard: SSL Orchestrator Job Status.
 - The Number of SSH
 The SSH (secure shell) protocol provides for secure connections between computers. It provides several options for authentication, including public key, and protects the communications with strong encryption. Keys per Type panel includes SSH keys found on discovery and those issued through the Management Portal and displays as a bar chart broken down by key type
 The key type identifies the type of key to create when creating a symmetric or asymmetric key. It references the signing algorithm and often key size (e.g. AES-256, RSA-2048, Ed25519).. See Dashboard: Number of SSH Keys per Type.
The panels on the dashboard are displayed in two columns. You can click and drag the dividing line between the two columns to change the width of the columns—for example, a wide left column and a narrower right column. The panels can be rearranged by dragging them up and down a column or from one column to the other. If you've chosen to change the column widths, you can arrange the wider panels in your wider column and the narrower panels in your narrower column.
The selected panels and their arrangement is unique to each user of the Management Portal. Out of the box, in addition to the risk header, the dashboard includes the Collections and Revocation Monitoring panels, so each new user to the dashboard will see these panels.
The latest version of the Logi reporting engine has functionality which avoids a system timeout issue by periodically pinging the IIS session behind the scenes so that the dashboard doesn't time out when the session has been idle. As a result, the dashboard no longer refreshes after 20 minutes, but invokes this new functionality instead. The settings used to control this depend on the Session State Timeout and Session Auto Keep Alive attribute settings in IIS. For more information on this see:
To add a panel for display on your dashboard:
-
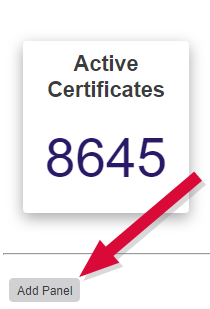
Click the Add Panel button on the left just below the dashboard risk header.

Figure 8: Click the Dashboard Add Panel Button
-
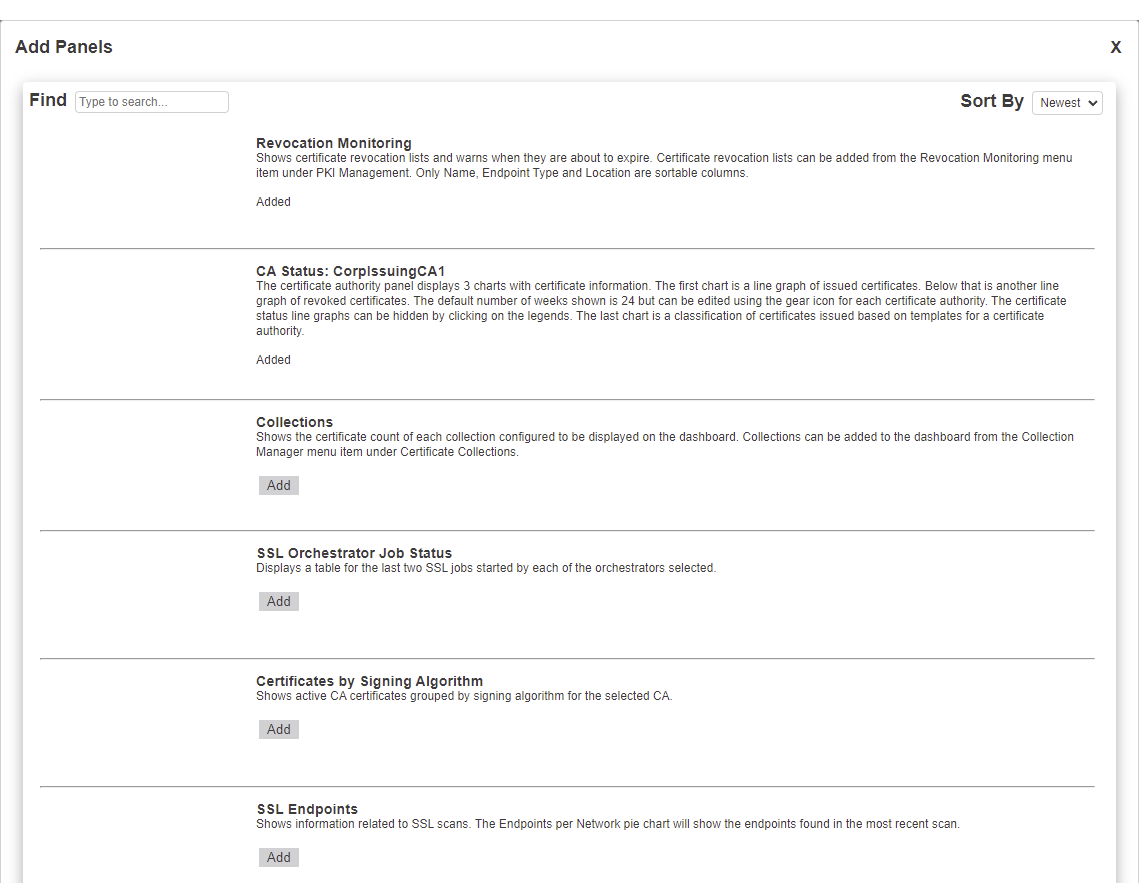
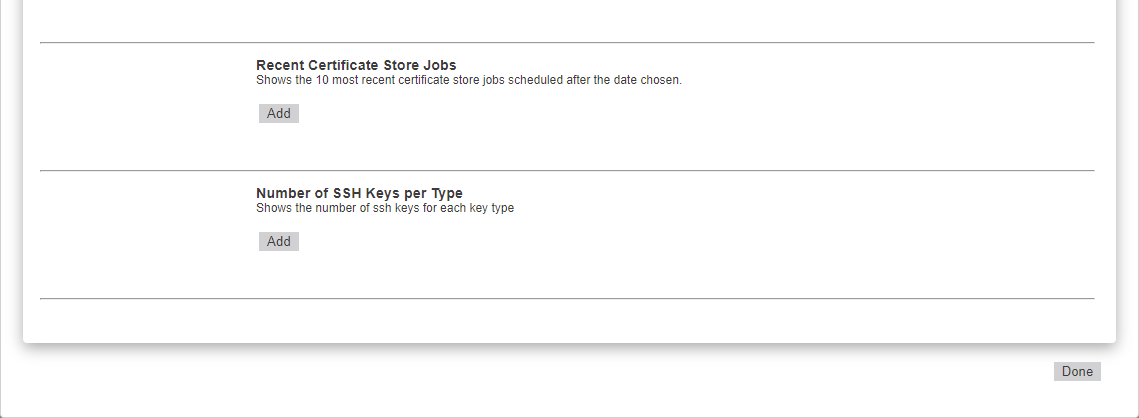
On the Add Panels dialog, select the panels you wish to display on the dashboard, click Add and then click Done at the bottom of the dialog.


Figure 9: Add Panels to the Dashboard
The panels displayed on the dashboard may be given user-defined names. To rename a displayed panel:
-
Click the panel Settings icon on the right of the panel you wish to rename and then click Rename.

Figure 10: Dashboard Panel Settings
-
In the title field of the panel, type a new name. Click away from the field to save.

Figure 11: Type in a New Name for the Panel
Note: Only letters, numbers, spaces, and select punctuation marks are supported in the panel name field. Special characters, such as < and > (and therefore HTML markup), are not supported.
To remove a panel from display on your dashboard:
-
Click the panel Settings icon on the right of the panel you wish to remove and then click Remove.

Figure 12: Dashboard Panel Settings
- When prompted, confirm that you are sure that you want to remove the panel.