
Dashboard functionality includes a pre-configured dashboard for initial setup, an edit mode for customizing dashboards, tools for adding and removing widgets, configuration options for available widgets, and dashboard permission settings.
Dashboard
 Switching Dashboards
For a limited time, the legacy dashboard and reporting component (Logi) remains available to install.
If Logi is installed, you can switch between the legacy dashboard and the new dashboard:
-
From the new dashboard, select the here link at the bottom of the page to open the legacy dashboard.
To configure the new dashboard, select Edit Dashboard in the upper-right corner to add widgets (see Add Widget), or use a pre-configured layout (see Use a Pre-Configured Dashboard).
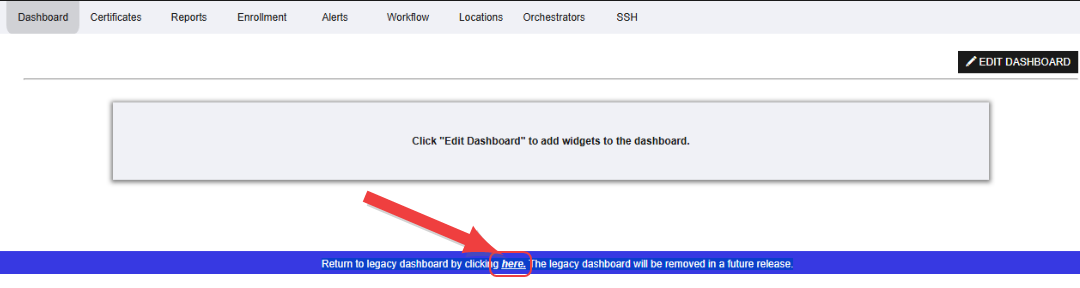
Figure 8: Legacy Dashboard Link
-
From the Legacy Dashboard, select the here link at the top of the page to open the new dashboard.

Figure 9: New Dashboard Link
When you select a dashboard (legacy or new), your preference is saved. The next time you access Keyfactor Command, the selected dashboard is displayed.
A blank dashboard is displayed in the following cases:
-
When accessing the new dashboard for the first time
-
When all widgets have been removed
Use a Pre-Configured Dashboard
When the dashboard is empty, the Configure New Dashboard dialog displays automatically if the user has access to at least one certificate collection The certificate search function allows you to query the Keyfactor Command database for certificates from any available source based on any criteria of the certificates and save the results as a collection that will be available in other places in the Management Portal (for example expiration alerts and certain reports). or has global certificate read permissions. This occurs when a user first accesses the new dashboard or when all widgets have been removed and the empty dashboard is saved.
You can also open this dialog by selecting Edit Dashboard and then Use Pre-Configured Dashboard.
The Configure New Dashboard dialog allows you to select a certificate collection to populate the dashboard with a pre-configured layout.
To set up a pre-configured database:
- Click Edit Dashboard from the top of the dashboard to open the dashboard workspace.
- Click Use Pre-Configured Dashboard to open the Configure New Dashboard dialog.
- In the Certificate Collection search select dropdown, select a certificate collection to base your set up of the pre-configured dashboard on.
-
Click Configure to add the default widgets to the dashboard workspace.
Note: Any existing widgets that were previously on the dashboard will be removed. - Continue to edit the dashboard, if desired, using the action buttons at the top of the workspace or by modifying widgets (see Dashboard Edit Mode).
- Click Save to save the dashboard. The dashboard exits edit mode.
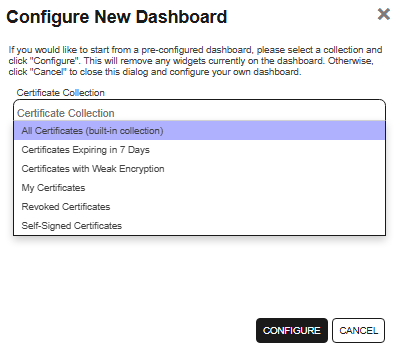
Figure 10: Configure New Dashboard Dialog
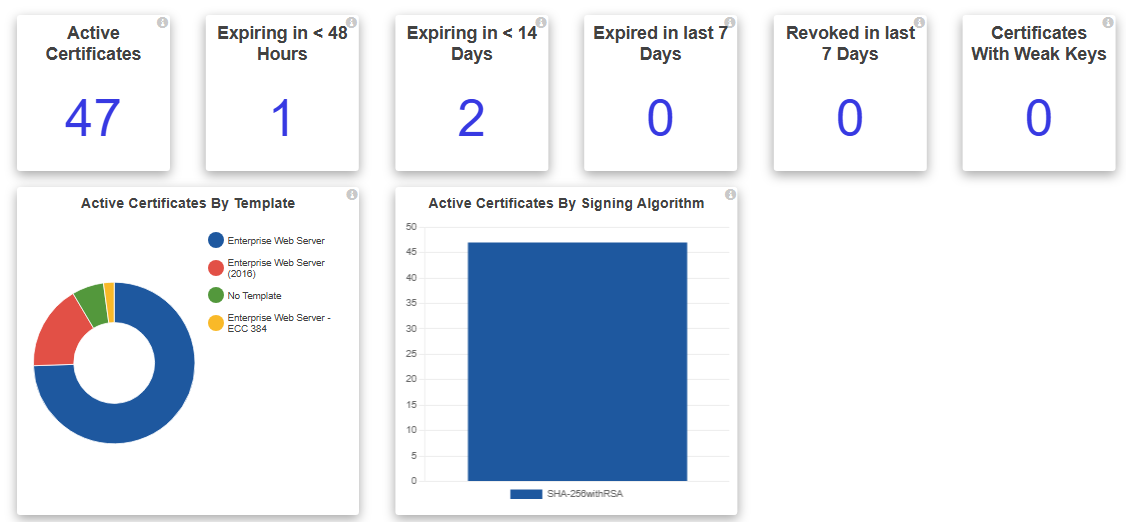
Figure 11: Pre-Configured Dashboard
Dashboard Edit Mode
From the Dashboard page on the Management Portal, set the dashboard into edit mode by clicking Edit Dashboard at the top right of the page.
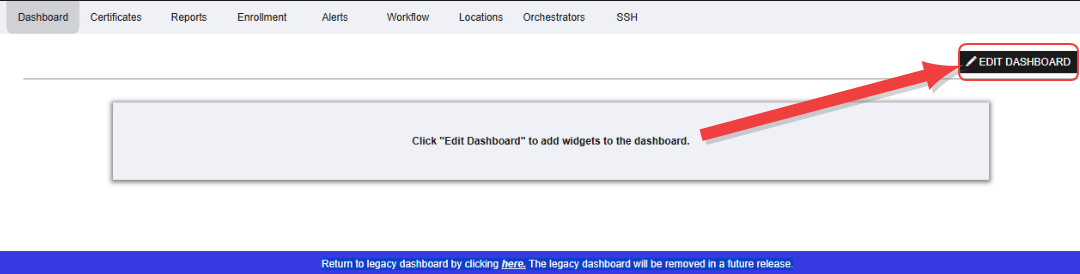
Figure 12: Initial Dashboard Edit Link from Default Dashboard
The dashboard workspace will be shaded gray, to indicate it is in edit mode and the dashboard action menu will appear at the top right of the page with the options Use Pre-Configured Dashboard, Add Widget, Remove All, Save, and Cancel. If there are existing widgets, editing icons ( and
and  ) will appear on each widget in edit mode.
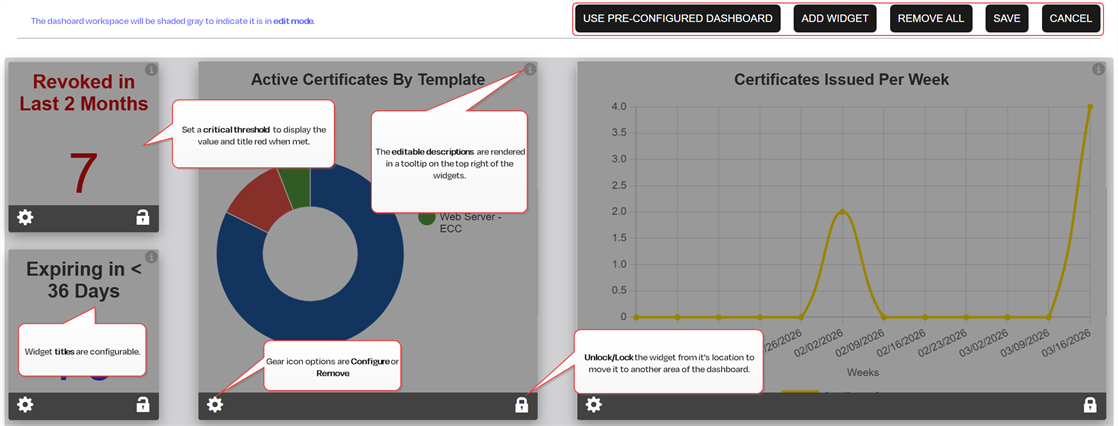
Figure 13: Dashboard Edit Mode
Edit Existing Widgets
For existing widgets, you can edit the configuration of a widget, change the position of the widget on the dashboard, or remove a widget.
To edit the configuration of an existing widget:
- Click Edit Dashboard from the top of the dashboard to open the dashboard workspace.
- Click the gear icon at the bottom left of the widget and select Configure.
- Click Configure to open the widget configuration dialog, where you can edit the widget Title, Description, and, for some widgets, additional widget-specific settings. For existing widgets, the dialog is prepopulated with the current configuration.
To remove an existing widget:
- Click Edit Dashboard from the top of the dashboard to open the dashboard workspace.
- Click the gear icon at the bottom left of the widget and select Remove.
-
When prompted, select OK to remove the widget from the dashboard, or Cancel to keep it.
Tip: To remove all widgets, use the Remove All action button.
To change the position of the widget on the dashboard:
The dashboard widgets can be organized up to 6 columns wide and extend vertically as necessary to fit all the configured widgets.
- Click Edit Dashboard from the top of the dashboard to open the dashboard workspace.
- If the widget is locked, click the unlock icon at the bottom right of the widget. The icon will change to unlocked to indicate it is movable
 .
. -
Drag the widget to the desired location.
Tip: You will not be able to move a widget to a position in which another locked widget is positioned. The available new locations for the widget will be determined by the size of the widget, and position and size of other widgets on the dashboard. You can unlock multiple widgets at the same time, in which case the unlocked widgets will move relative to each other as the widget is repositioned, until it is locked. - Click to lock it in place. Once locked, the widget does not automatically move when other widgets are placed over it.
To save your dashboard configuration:
Click Save at the top right of the workspace to save your changes.
The dashboard will exit edit mode by reverting to its original color and hiding the editing icons. Saving will persist the widget positions and configurations to the database for the current user profile.
Add Widget
The Add Widget dialog allows you to browse and add dashboard widgets organized by category. Each category is presented as a tab, grouping related widgets such as certificate counts, SSL TLS (Transport Layer Security) and its predecessor SSL (Secure Sockets Layer) are protocols for establishing authenticated and encrypted links between networked computers. data, issuance timelines, and revocation monitoring.
Select a widget from any tab to open a Configure dialog with options specific to that widget. All widgets support a customizable Title and Description, and some widget types include additional configurable fields.
Dashboard widgets can be arranged up to six columns wide and can extend vertically to a maximum of 20 widgets.
Working with Certificate Collections and Widgets
When working with collections on the dashboard, note the following:
-
Some widgets require a separate widget instance for each collection when displaying data from multiple collections.
-
A user’s collection permissions determine which collections are available for selection.
-
All widgets and analytics endpoints that use collections support user-specific tokens (%ME%, %ME-AN%, %ROLES%). See Special Token Values for details.
-
Counts for collections using special tokens are cached based on the Collection Caching Interval application setting (see Application Settings: Dashboard and Reports Tab.
The available widgets are organized on the following tabs:
Certificate Counts Tab
The Certificate Counts tab includes count tile widgets that you can configure and add to your dashboard (see Count Tile for details).
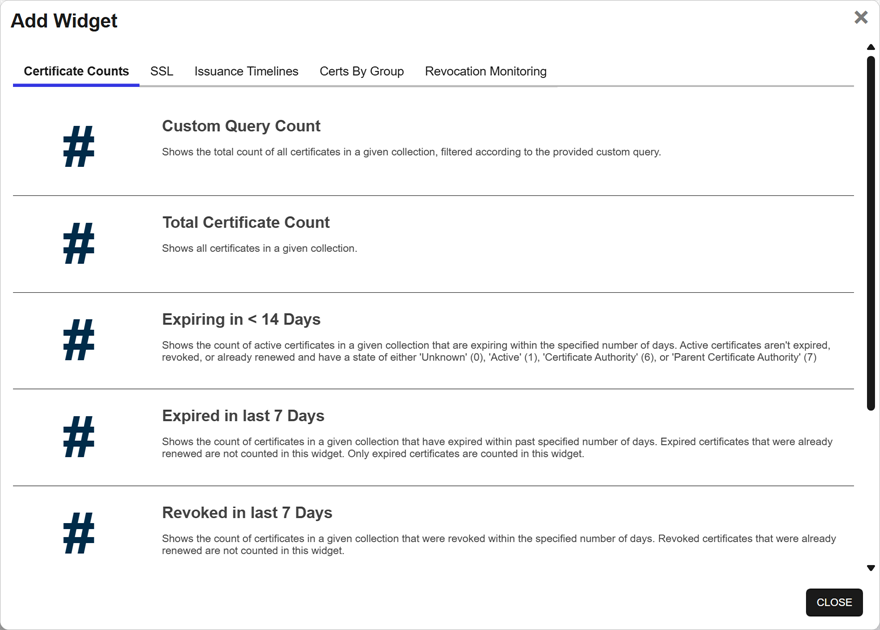
Figure 14: Certificate Counts Tab
The available widgets include:
-
The Custom Query Count value shows the total count of all certificates in a given collection, filtered according to the provided custom query.
The query input allows for a query on one field using the Simple view, or multiple fields using Advanced. With Advanced selection, an insert and clear button are added, and the textbox will show the full query as defined. See Searching Certificates for more information about working with queries. Each section of the query cannot exceed 255 characters. Upon editing an existing widget, the query section will pre-populate with the view as defined (for example, simple or advanced).

Figure 15: Custom Query Count - Query - Advanced View
The Title, Description, Certificate collection, and Critical threshold can be edited to customize your dashboard. The certificate collection field is a search select dropdown. To narrow the list of results in a search select dropdown, begin typing in the input field. Matching results will appear as you type, and you can scroll to locate a record.
This is a square, one-by-one (1×1) Count Tile widget.
-
Total Certificate Count
The Total Certificate Count value reflects all certificates in a specific collection, excluding expired certificates, revoked certificates, and certificates that have been renewed.
The Title, Description, Certificate collection, and Critical threshold can be edited to customize your dashboard. The certificate collection field is a search select dropdown. To narrow the list of results in a search select dropdown, begin typing in the input field. Matching results will appear as you type, and you can scroll to locate a record.
This is a square, one-by-one (1×1) Count Tile widget.
-
Expiring in < 14 (or user-defined #) Days
The Expiring in Days value includes all active certificates in the specified collection with an expiration date between the current date/time and a specific number of days that you set on the Days until Expiration field (to the minute) from the current date/time. This value:
- Excludes: Expired certificates, revoked certificates, and certificates that have been renewed (to avoid counting both the original certificate and the replacement certificate)
- Includes: Certificates that have a state of Unknown, Active, Certificate Authority A certificate authority (CA) is an entity that issues digital certificates. Within Keyfactor Command, a CA may be a Microsoft CA or a Keyfactor gateway to a cloud-based or remote CA., or Parent Certificate Authority
The Title, Description, Certificate collection, Days until expiration, and Critical threshold can be edited to customize your dashboard. The certificate collection field is a search select dropdown of the collections the user has access to. To narrow the list of results in a search select dropdown, begin typing in the input field. Matching results will appear as you type, and you can scroll to locate a record.
This is a square, one-by-one (1×1) Count Tile widget.
-
Expired in the last 7 (or user-defined #) Days
The Expired in Days value shows the count of certificates in the specified collection that have expired within past number of days as set on the Days until Expiration field. This widget counts only expired certificates. Certificates that have already been renewed are not included.
The Title, Description, Certificate collection, Expired in days, and Critical threshold can be edited to customize your dashboard. The certificate collection field is a search select dropdown. To narrow the list of results in a search select dropdown, begin typing in the input field. Matching results will appear as you type, and you can scroll to locate a record.
This is a square, one-by-one (1×1) Count Tile widget.
-
Revoked in last 7 (or user-defined #) Days
The Revoked in Days value represents the number of certificates that have been revoked within a user-defined number of days for the specified collection.
The Title, Description, Certificate collection, Revoked in days, and Critical threshold can be edited to customize your dashboard. The certificate collection field is a search select dropdown. To narrow the list of results in a search select dropdown, begin typing in the input field. Matching results will appear as you type, and you can scroll to locate a record.
This is a square, one-by-one (1×1) Count Tile widget.
-
Active Certificates
The Active Certificates value represents the number of active certificates in the specified collection, including those with a certificate state of unknown, and excludes expired certificates, revoked certificates, and certificates that have been renewed (to avoid counting both the original certificate and the replacement certificate).
The Title, Description, Certificate collection, and Critical threshold can be edited to customize your dashboard. The certificate collection field is a search select dropdown. To narrow the list of results in a search select dropdown, begin typing in the input field. Matching results will appear as you type, and you can scroll to locate a record.
This is a square, one-by-one (1×1) Count Tile widget.
-
Certificates with Weak Keys
The Certificates with Weak Keys value includes all certificates in the database that are deemed to have weak keys. Weak key certificates are those with:
-
Signature algorithm SHA-1
-
Signature algorithm MD5
-
RSA keys under 2048 bits
-
ECC keys under 224 bits
-
Are neither expired nor revoked and have a state of Unknown (0), Active (1), Certificate Authority (6), or Parent Certificate Authority (7)
This value excludes expired certificates, revoked certificates, and includes certificates that have been renewed.
The Title, Description, Certificate collection, and Critical threshold can be edited to customize your dashboard. The certificate collection field is a search select dropdown. To narrow the list of results in a search select dropdown, begin typing in the input field. Matching results will appear as you type, and you can scroll to locate a record.
This is a square, one-by-one (1×1) Count Tile widget.
-
SSL Tab
The SSL tab widgets relate to SSL discovery an monitoring.
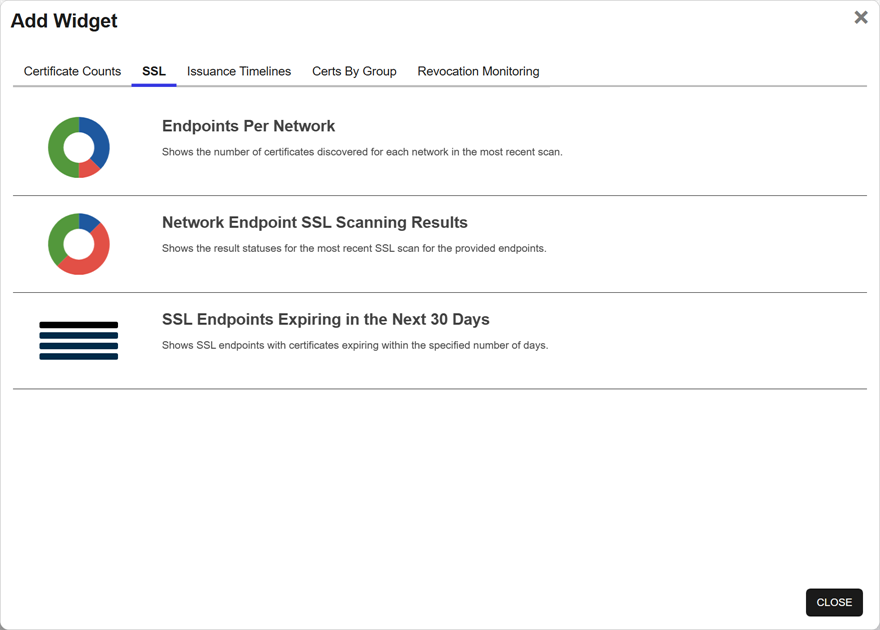
Figure 16: SSL Tab
The available widgets include:
-
Endpoints per Network
The Endpoints per Network widget displays discovered SSL endpoints grouped by SSL network. The chart represents all discovered endpoints, including:
-
Endpoints where a certificate is currently detected
-
Endpoints where a certificate was previously detected but is no longer present
-
Endpoints that responded to the scan but did not present a certificate
Click a section of the pie chart to view matching results on the SSL Discovery Results page. Use the labels below the chart to toggle individual segments on or off.
The Title, Description, and Networks can be edited to customize your dashboard. The Networks field defaults to using all networks. It’s a search select dropdown that allows you to search for and add multiple networks one at a time. After selecting a network, click Add to insert it into the grid, then repeat as needed. To narrow the list of results in a search select dropdown, begin typing in the input field. Matching results will appear as you type, and you can scroll to locate a record.
Note: When editing an existing widget, a red info icon will appear in the top of the search select grid on the widget configuration page if widget data includes an entity that no longer exists (due either to deletion or lost permissions, for example).This is a square, two-by-two (2×2) Doughnut Chart widget.
-
-
Network Endpoint SSL Scanning Results
The Network Endpoint SSL Scanning Results widget shows the results from the most recent SSL scan (discovery or monitoring) broken out by result (for example, certificate found, connection timed out, connection refused). The widget aggregates the totals of the statuses across the networks and displays the aggregated totals. Click on a section of the pie chart to be taken to the SSL Discovery Results page.
The Title, Description, and Networks can be edited to customize your dashboard. The Networks field defaults to using all networks. It’s a search select dropdown that allows you to search for and add multiple networks one at a time. After selecting a network, click Add to insert it into the grid, then repeat as needed. To narrow the list of results in a search select dropdown, begin typing in the input field. Matching results will appear as you type, and you can scroll to locate a record.
Note: When editing an existing widget, a red info icon will appear in the top of the search select grid on the widget configuration page if widget data includes an entity that no longer exists (due either to deletion or lost permissions, for example).This is a square, two-by-two (2×2) Doughnut Chart widget.
-
SSL Endpoints Expiring in the Next 30 (or user-defined #) Days
The Endpoints Expiring in the Next x Days widget displays up to ten SSL endpoints with certificates expiring in the next # of days as specified in the Days until Expiration field. This grid only displays if there are endpoints that meet that criteria. If there are more than ten to display, the certificates expiring soonest are displayed. The grid includes the network name, the endpoint
An endpoint is a URL that enables the API to gain access to resources on a server. address, the certificate expiration date, and the certificate common name A common name (CN) is the component of a distinguished name (DN) that represents the primary name of the object. The value varies depending on the type of object. For a user object, this would be the user's name (for example CN=John Smith). For SSL certificates, the CN is typically the fully qualified domain name (FQDN) of the host where the SSL certificate will reside (for example servername.keyexample.com or www.keyexample.com)., if any.The Title, Description, and Days until Expiration can be edited to customize your dashboard.
This is a rectangular, three-by-two (3×2)Grid widget.
Issuance Timelines Tab
The Issuance Timelines tab has line plot widgets that return the number of certificates issued or revoked in one or more specified periods.
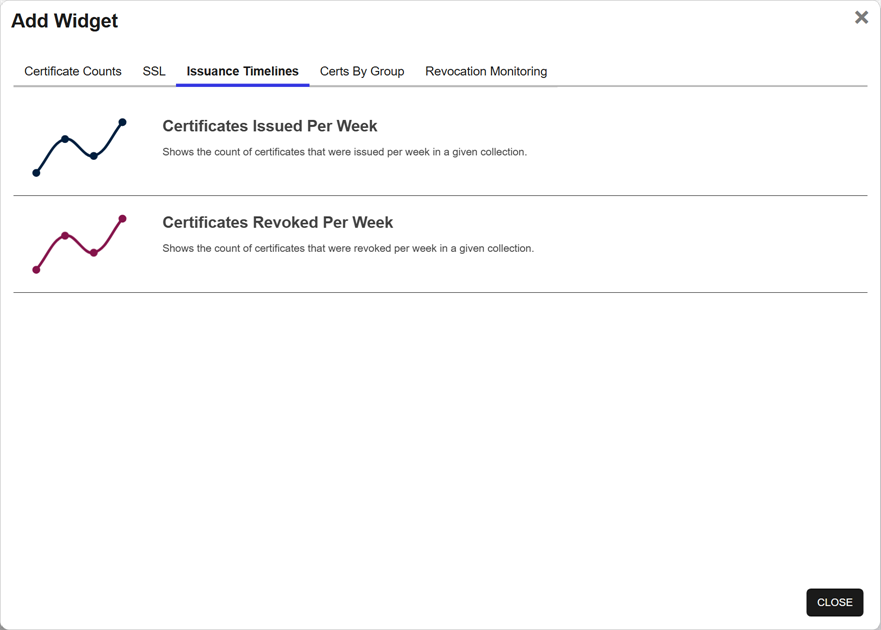
Figure 17: Issuance Timelines Tab
The available widgets include:
-
Certificates Issued per Week
The Certificates Issued per Week widget returns the number of certificates issued in each of the time periods requested in a three-by-two (3×2) Line Plot widget.
The Title, Description, Certificate collection, and Total Periods can be edited to customize your dashboard. The required Total Periods parameter A parameter or argument is a value that is passed into a function in an application. determines how many weeks of data to return from the current date (must be greater than 0 and less than or equal to 52). The certificate collection field is a search select dropdown. To narrow the list of results in a search select dropdown, begin typing in the input field. Matching results will appear as you type, and you can scroll to locate a record.
-
Certificates Revoked per Week
The Certificates Revoked per Week widget returns the number of certificates revoked in each of the time periods requested in a three-by-two (3×2) Line Plot widget.
The Title, Description, Certificate collection, and Total Periods can be edited to customize your dashboard. The required Total Periods parameter determines how many weeks of data to return from the current date (must be greater than 0 and less than or equal to 52). The certificate collection field is a search select dropdown. To narrow the list of results in a search select dropdown, begin typing in the input field. Matching results will appear as you type, and you can scroll to locate a record.
Certs By Group Tab
The Certs by Group tab includes charts of certificates by groupings.
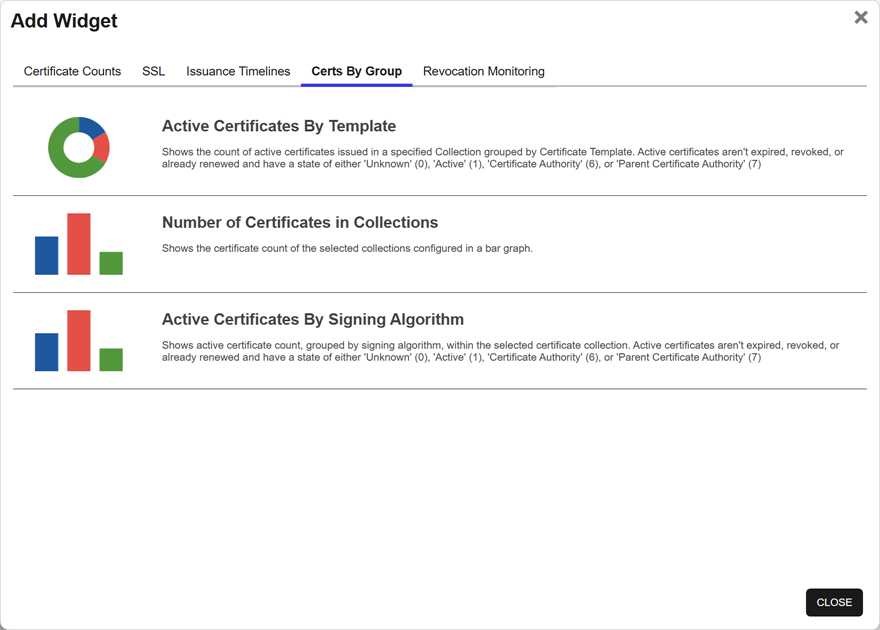
Figure 18: Certs By Group Tab
A certificate with a single, primary post-quantum key. are not currently supported in The available widgets include:
-
Active Certificates By Template
The Active Certificates By Template widget shows the count of active certificates issued in a specified collection grouped by certificate template
A certificate template defines the policies and rules that a CA uses when a request for a certificate is received.. Active certificates:- Are not expired, revoked, or already renewed
- Have a state of Unknown, Active, Certificate Authority, or Parent Certificate Authority
The Title, Description, and Certificate collection can be edited to customize your dashboard. The certificate collection field is a search select dropdown. To narrow the list of results in a search select dropdown, begin typing in the input field. Matching results will appear as you type, and you can scroll to locate a record.
This is a square, two-by-two (2×2) Doughnut Chart widget.
-
Number of Certificates in Collections
The Number of Certificates in Collections widget shows the certificate count of the selected collections configured in a bar graph.
The Title, Description, and Certificate collection can be edited to customize your dashboard. The certificate collection field is a search select dropdown that lets you search for and add multiple collections one at a time. After selecting a collection, click Add to insert it into the grid, then repeat as needed. To narrow the list of results in a search select dropdown, begin typing in the input field. Matching results will appear as you type, and you can scroll to locate a record.
Note: When editing an existing widget, a red info icon will appear in the top of the search select grid on the widget configuration page if widget data includes an entity that no longer exists (due either to deletion or lost permissions, for example).This is a square, two-by-two (2×2) Bar Graph widget. Collections on the bar graph appear in the order they were specified in the local selection grid.
-
Active Certificates by Signing Algorithm
The Active Certificates by Signing Algorithm widget shows a bar chart of all active certificates in Keyfactor Command from the following sources:
- Synchronized from an EJBCA CA A certificate authority (CA) is an entity that issues digital certificates. Within Keyfactor Command, a CA may be a Microsoft CA or a Keyfactor gateway to a cloud-based or remote CA., Microsoft CA or Keyfactor CA gateway
- Imported via SSL scanning, certificate store inventorying, or manual import
The values returned include the signing algorithm name and counts by signing algorithm for the specified collection.
The Title, Description, and Certificate collection can be edited to customize your dashboard. The certificate collection field is a search select dropdown. To narrow the list of results in a search select dropdown, begin typing in the input field. Matching results will appear as you type, and you can scroll to locate a record.
This is a square, two-by-two (2×2) Bar Graph widget.
- Synchronized from an EJBCA CA
Revocation Monitoring Tab
The Revocation Monitoring tab includes widgets that support CRL A Certificate Revocation List (CRL) is a list of digital certificates that have been revoked by the issuing Certificate Authority (CA) before their scheduled expiration date and should no longer be trusted. and OSCP monitoring.
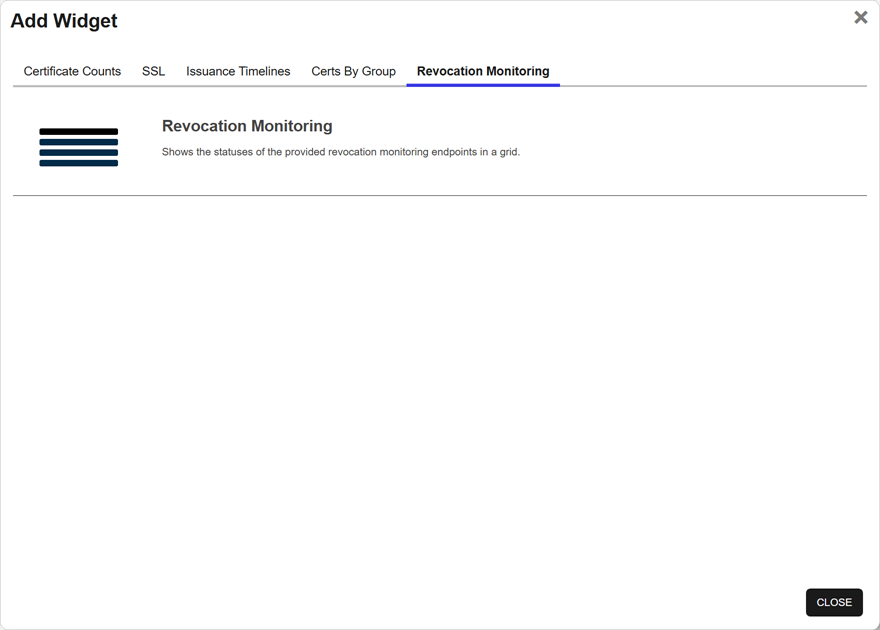
Figure 19: Revocation Monitoring Tab
The available widgets include:
-
Revocation Monitoring
The Revocation Monitoring widget displays details, including the endpoint status, of selected CRL and OCSP endpoints in a grid format.
CRL endpoints include status indicators for:
-
Valid
-
Warning
-
Expired
-
Unavailable
OCSP endpoints display status based on endpoint responsiveness only (Valid or Unavailable). Expiration is not applicable.
Hovering over a Location column value displays a tooltip with the full value of the location.
The Title, Description, and included endpoints can be edited to customize your dashboard. At least one endpoint must be provided up to a maxiumum of 25 endpoints.
This is a rectangular, three-by-two (3×2)Grid widget.
-
Dashboard Permissions
A user's permissions will determine the dashboard functionality that is available to them. For a list of the permission required for working with the dashboard, see Table 8: Dashboard Permission Requirement Matrix.
Table 8: Dashboard Permission Requirement Matrix
| Category | Widgets |
API Permissions |
Portal Permission |
|---|---|---|---|
| Dashboard Access | All Widgets | /dashboard/read/ | Global > Dashboard > Read |
| Certificate Widgets |
|
/certificates/collections/read/ OR /certificates/collections/read/#/ (where # is a reference to a specific certificate collection ID) |
Global > Certificates > Read, or Read on at least one collection. |
| SSL widgets |
|
/ssl/read/ | Global > Ssl > Read |
| Revocation Monitoring widgets |
|
/certificate_authorities/read/ | Global > Certificate Authorities > Read |